In this post I’ll be showing you the result of my analysis of some WoW private server auction house data. If you don’t know what that is, check out my previous post about it.
The data from the auctioneer addon has individual entries for each transaction, but that’s more detail than I needed. When I ran my script that processed a day’s scan, I reduced the entries to one per item type and computed the average, minimum, maximum and median price for that item. The end result was a bunch of CSV files with the timestamp of the scan and information about each item type found on the auction house at the time. Another interesting thing is that, because these are just the asking prices, outliers can really mess up the average. For example, let’s say we have an item that usually sells for 5000 units of money, which translates into 50 silver. However, someone could list one for 100 silver, which throws the average up considerably.
Now for the fun part. I have 3 pieces of data for each item for each of my scans, so that can be pretty easily graphed. Let’s start with averaging each of these values across all items and see what happens to the server’s economy as a whole over time. I threw the data into matplotlib’s pyplot and made this rough first graph.
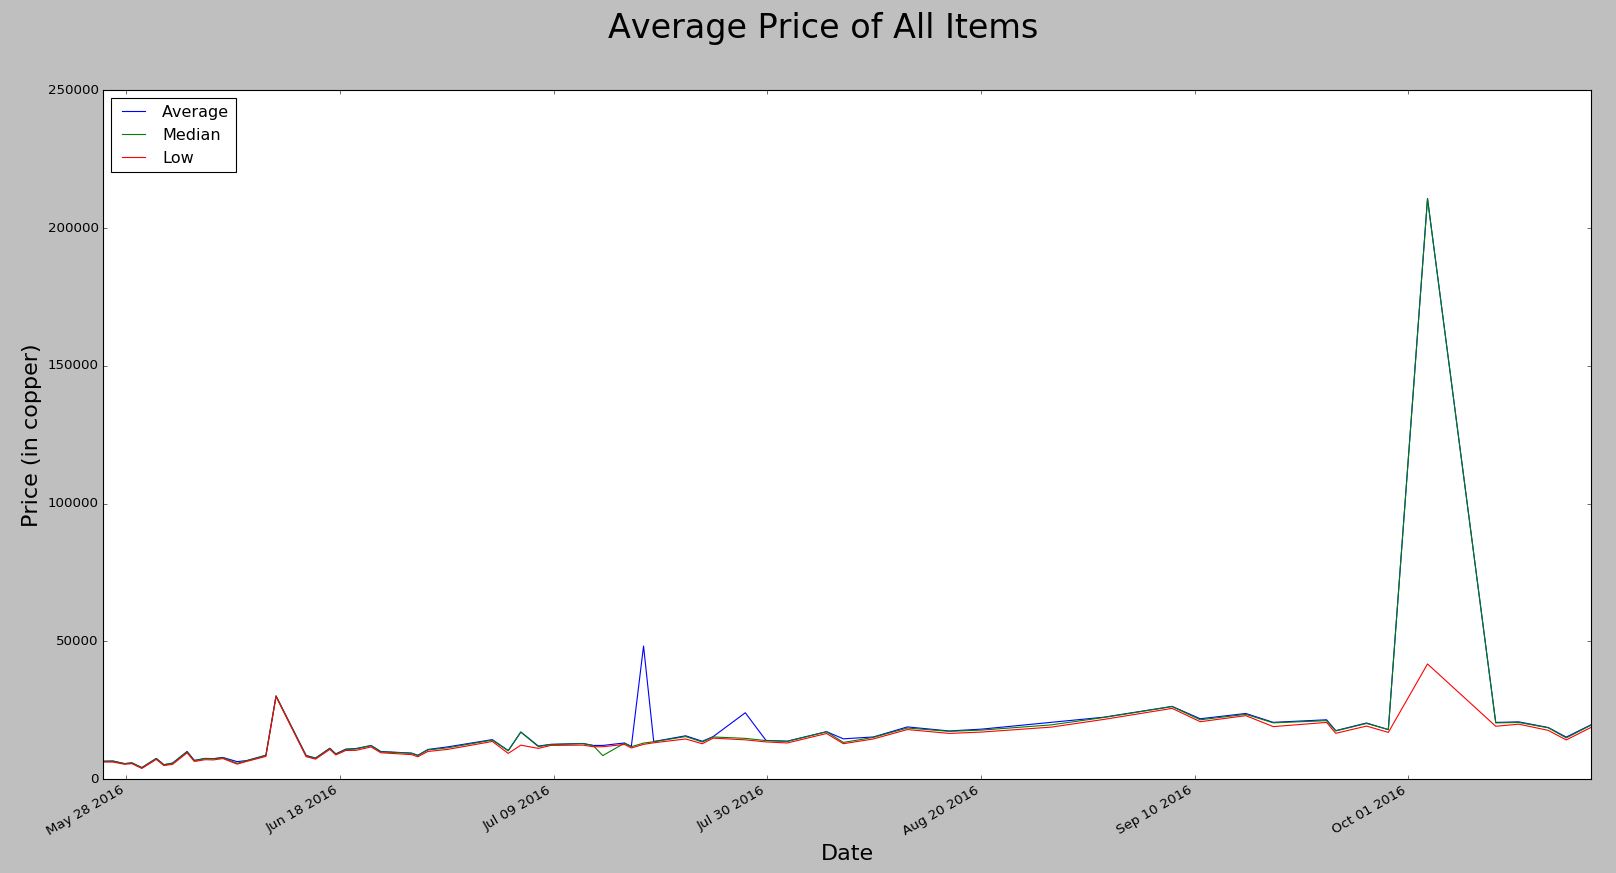
That’s strange. Something is throwing off the values. I did some snooping and found that it is yet another result of only the asks being shown. On October 2nd, for example, someone put up a completely worthless book for 200,000 gold! Keep in mind that the most expensive items in the game only sell for a few hundred. I added a filter for any listing above 200 gold and ran it again.
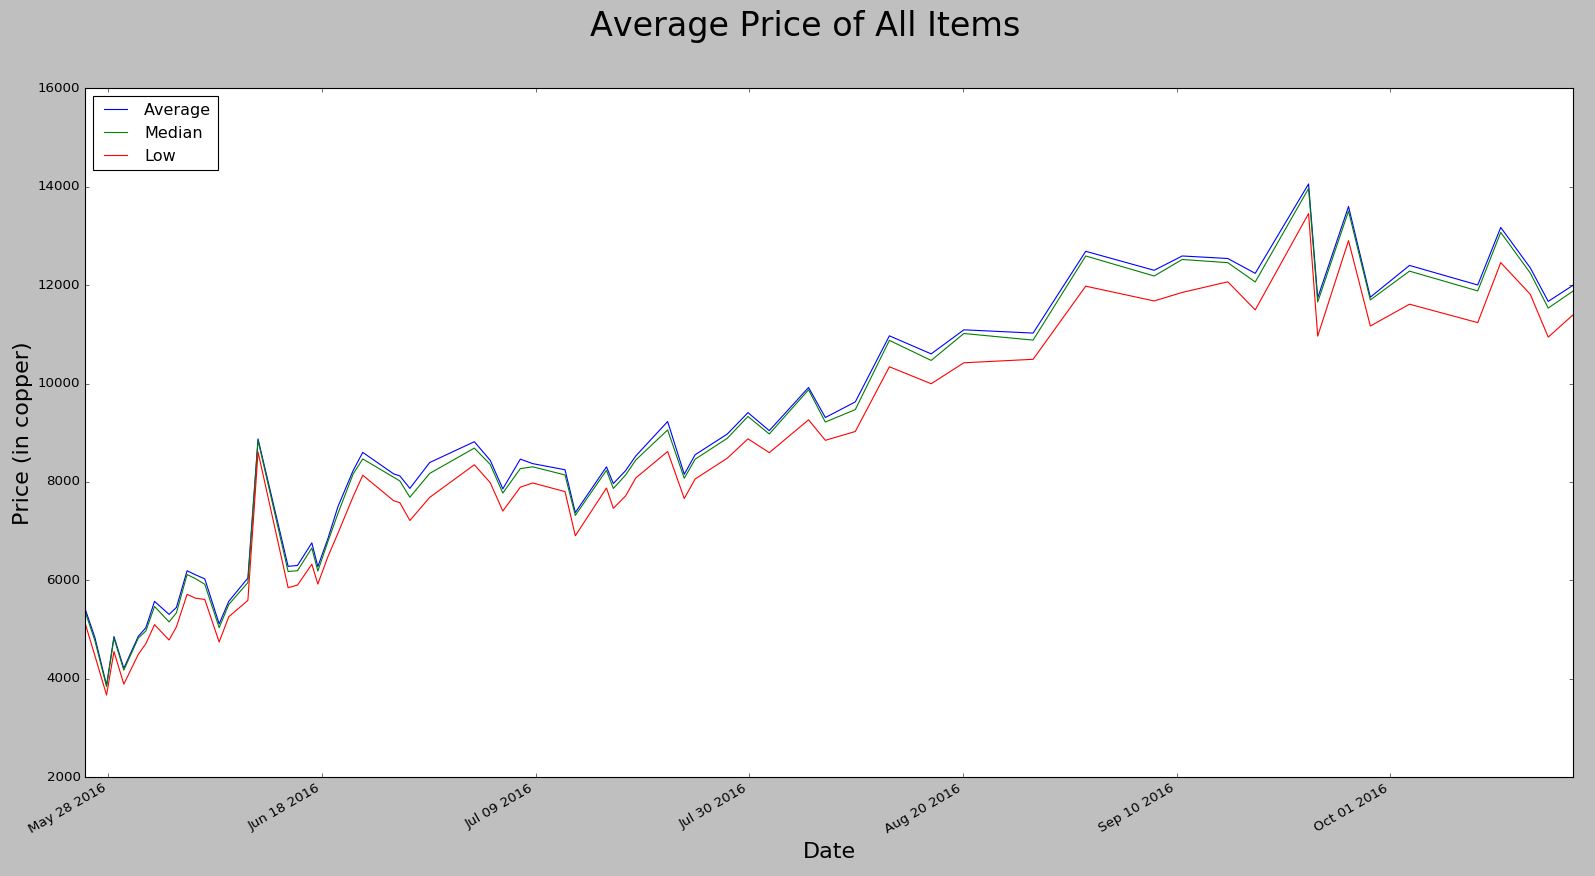
Much better. This definitely confirms that there was inflation in the entire economy over time. The average item quadrupled from 40 silver to 1 gold 20 silver. This makes sense, because as players get to higher levels they can defeat enemies that give more money. They also get past buying a mount, which is the largest money sink in the game. Inflation seems to have leveled out in about late August. Let’s compare this to the total number of items for sale on the auction house over time.
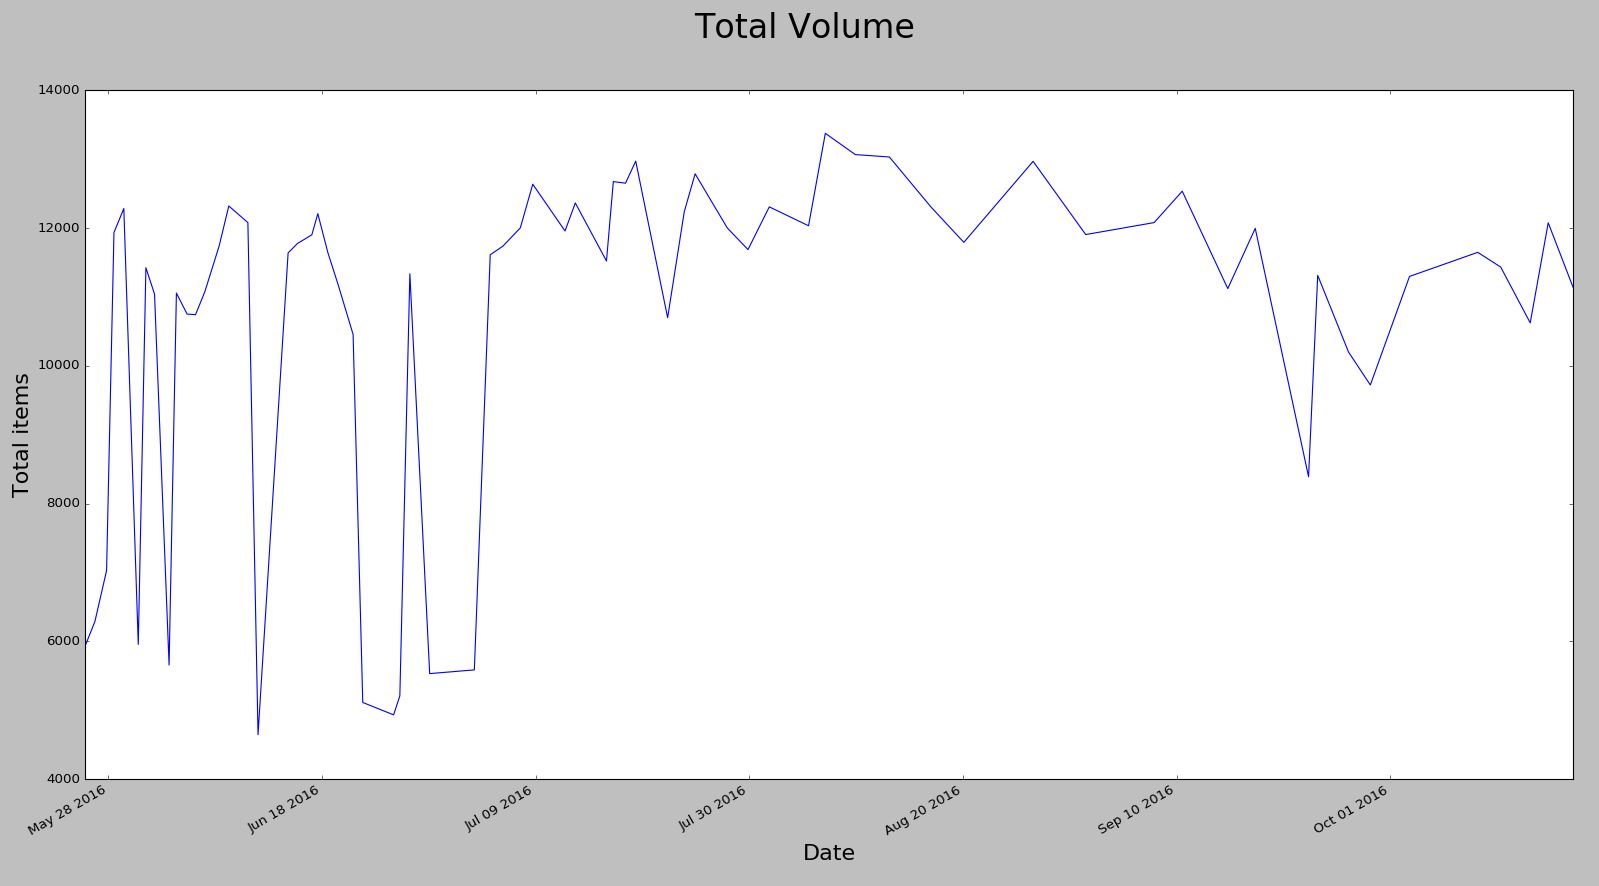
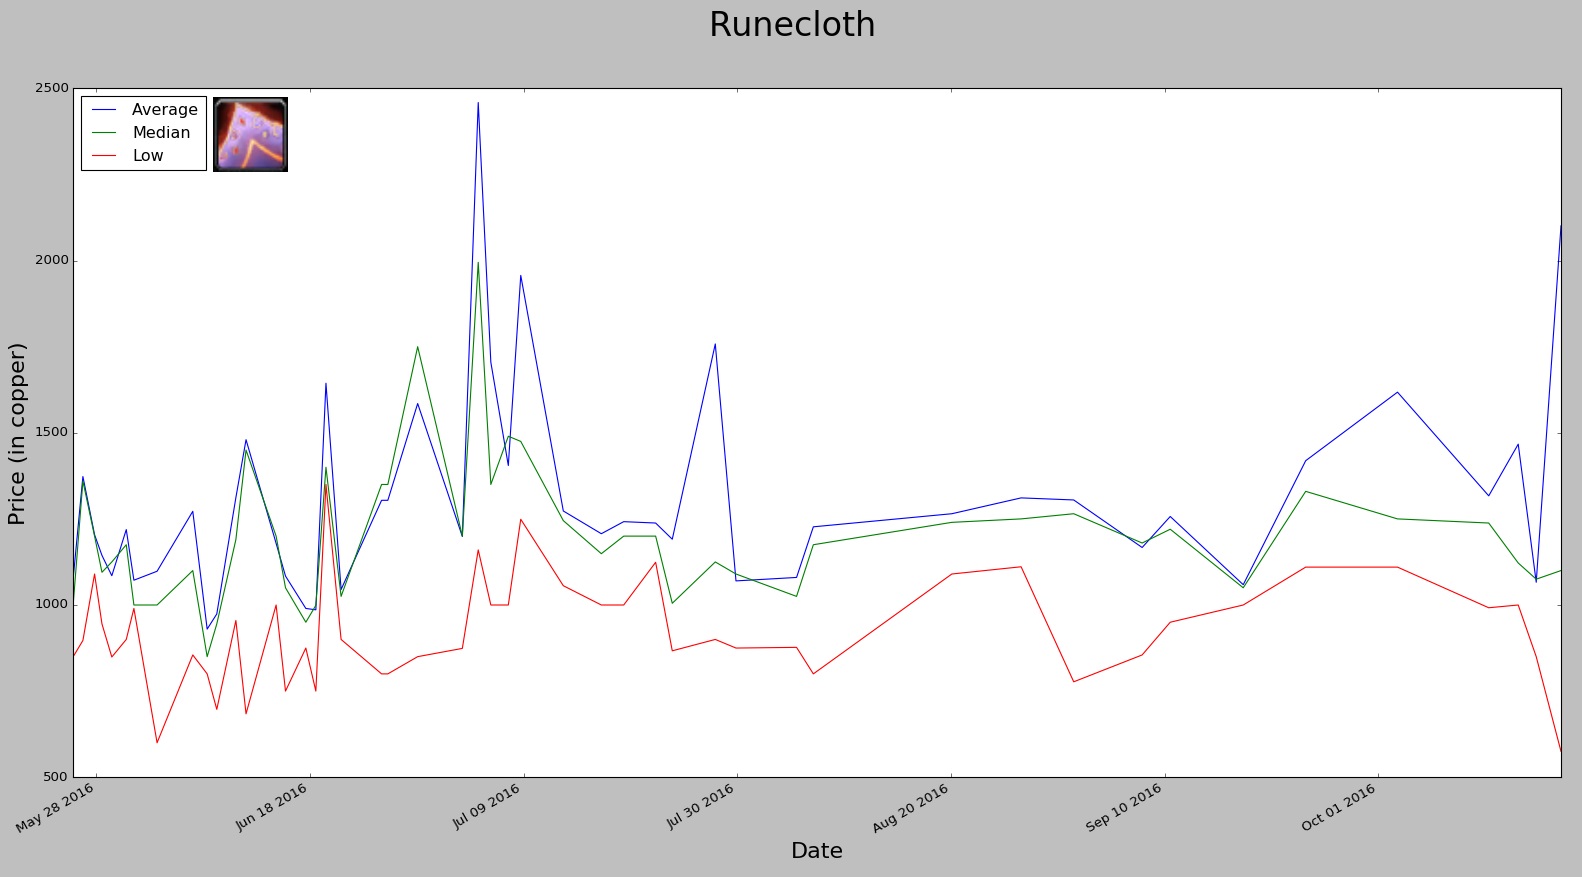
Some fluctuation at the beginning aside, the volume stayed mostly constant. Now let’s look at some individual items. The game has raw resources, intermediate crafting components, crafted equipment and rare tradeable equipment dropped by monsters. Let’s look at cloth, for example. There are 6 main types of cloth in the game and each is only dropped by enemies of certain levels. Linen is the lowest level cloth available, runecloth is at the highest level, and felcloth is a high-level and rare drop.
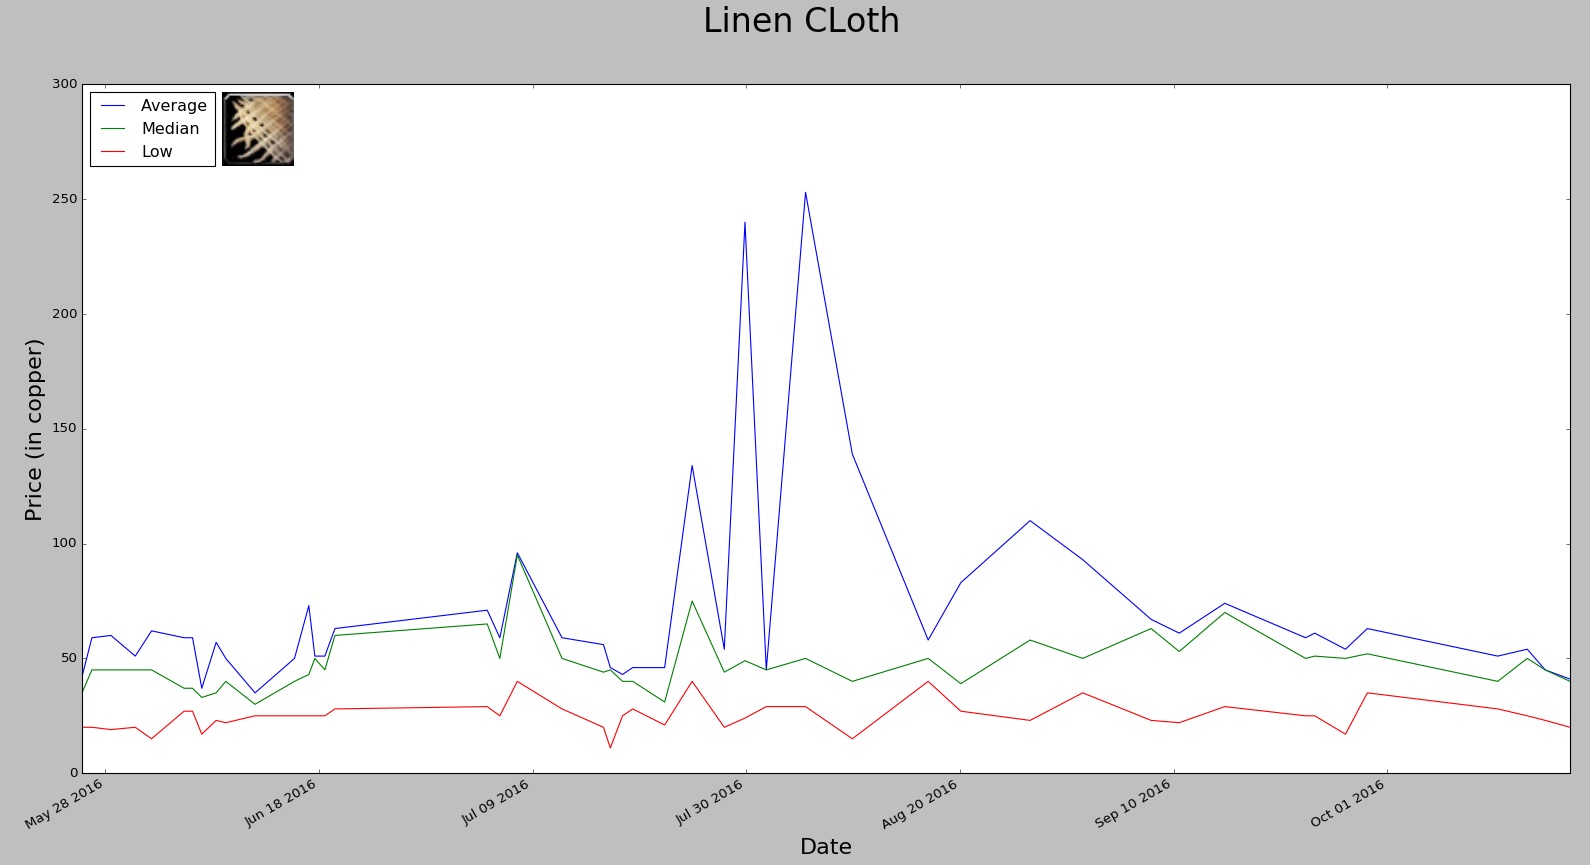
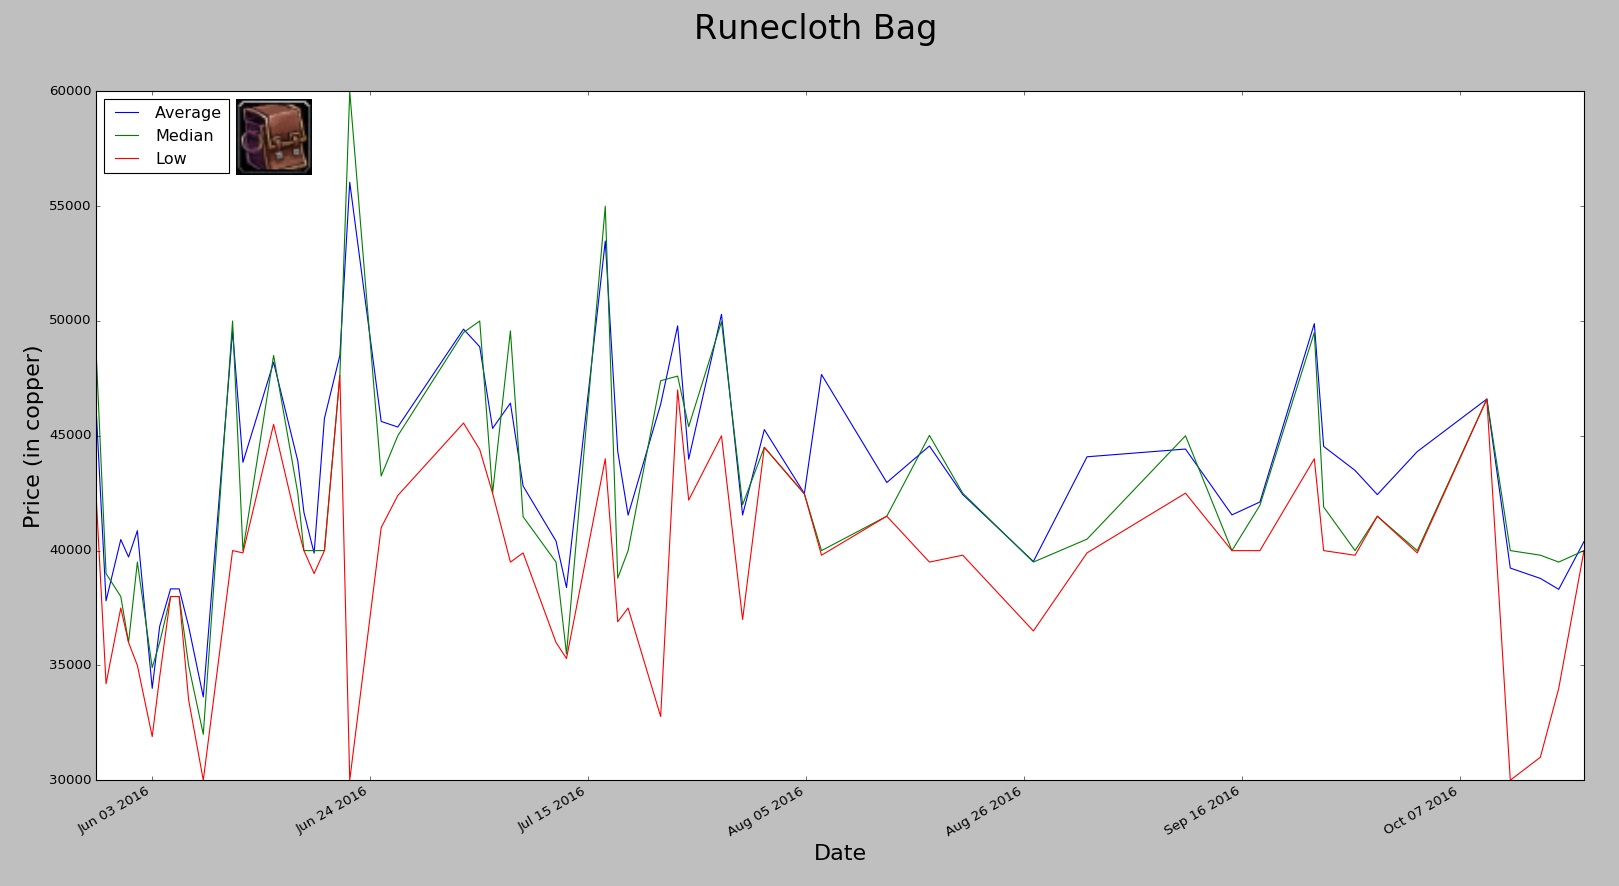
The price of linen is pretty stable. This makes sense because just about every character can get it, so supply is constant. Runecloth is a little more stable, though it seems to drop a little bit after a while. Runecloth bags, which use runecloth and need a relatively high tailoring skill to make, have pretty high volatility, but do go down over time as more people level their tailoring.
The price of a piece of felcloth actually increases from 2 gold to 3.5 gold over time, which surprised me. This is probably because it’s hard to obtain, so the supply is constant, but more people level their tailoring over time so the demand increased.
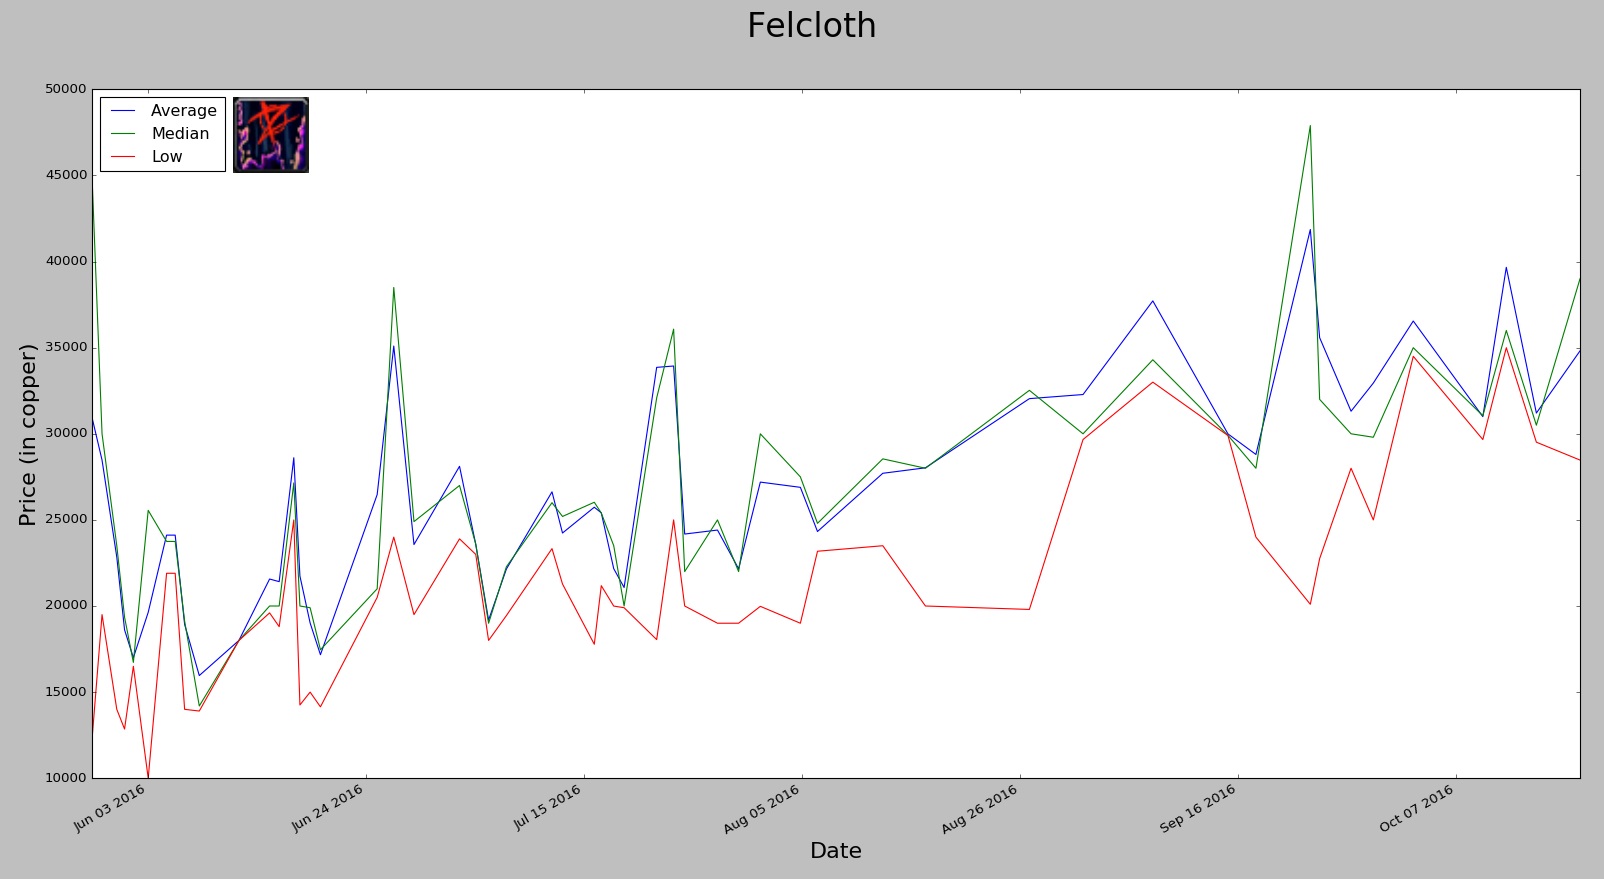
One final thing of note is that sometimes the median is actually lower than the average. This happens when there are outliers that are relatively low and means that I just happened to do a scan when someone had a good deal listed. These obviously won’t last long before being bought up and in fact we see this work itself out when we look at all the items. Hopefully you found this interesting. I enjoyed playing with the data and confirming a lot of what I knew intuitively from playing the game.